Is Your Peptide Actually Pure? How to Test Peptide Purity
Disclaimer: The information provided in this article is for educational and informational purposes only. It is not intended as medical advice, diagnosis, or treatment. Products and compounds referenced are for research use only and are not approved for human or veterinary consumption. Always consult a qualified professional regarding health or medical decisions.
Is the Peptide in That Vial Actually What It Claims to Be?
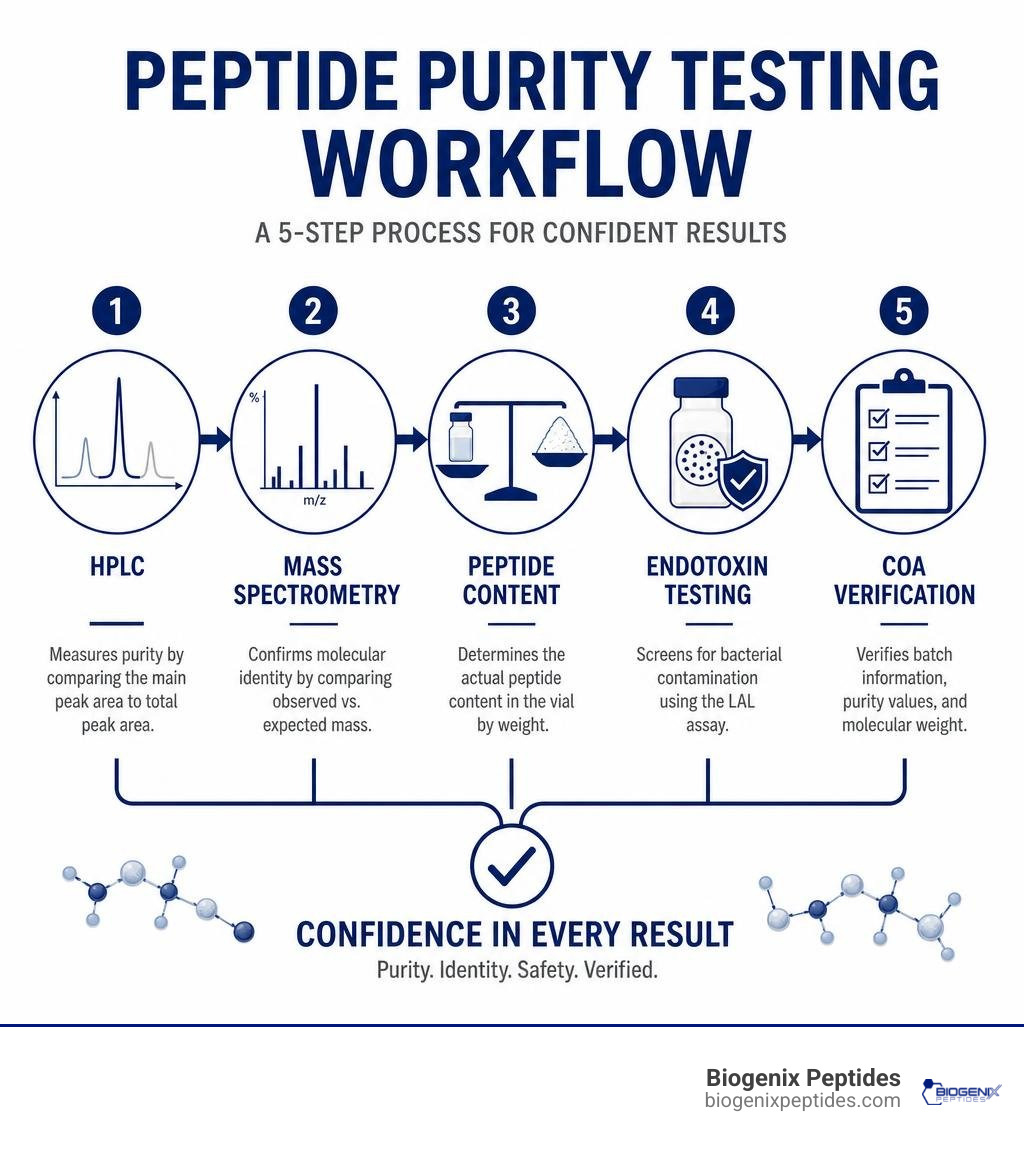
Knowing how to test peptide purity is one of the most important skills any researcher can develop. Here is a quick overview of the core methods:
- HPLC (High-Performance Liquid Chromatography) — measures purity as a percentage of the main peak area vs. total peaks; the gold standard for purity analysis
- Mass Spectrometry (ESI-MS or MALDI-TOF) — confirms the peptide’s molecular identity by comparing observed vs. expected molecular weight
- Peptide Content Testing — determines what fraction of the total vial weight is actual peptide (vs. salts, moisture, and residual solvents)
- Endotoxin Testing (LAL Assay) — screens for bacterial contamination, critical for injectable research applications
- COA Verification — cross-checking the Certificate of Analysis for batch numbers, realistic purity values, and correct molecular weight
A peptide vial can look fine and still fall short. Think of a Certificate of Analysis like a vehicle inspection report — one without a batch number is like an inspection certificate with no VIN. It tells you nothing about what’s actually in front of you.
Purity percentages reported on a COA only capture part of the picture. TFA salts alone can account for 10–30% of a lyophilized peptide’s total weight, meaning a labeled 10 mg vial might contain only 7–8.5 mg of actual peptide. For research accuracy, that gap matters enormously.
I’m Jay Daniel, Founder and CEO of BioGenix Peptides, and over years of hands-on work in peptide sourcing, quality control, and purity validation, I’ve developed deep expertise in how to test peptide purity at every stage of the supply chain. In the sections below, I’ll walk you through each method in detail so you can evaluate any peptide sample with confidence.
HPLC Purity vs. Peptide Content: The Crucial Difference
When researchers first look at a Certificate of Analysis (COA), they often jump straight to the “Purity” percentage. If it reads “98.5%,” they assume that 98.5% of the powder inside the vial is the target peptide. Unfortunately, this is a major misconception that can completely derail experimental precision.
There is a fundamental difference between HPLC purity and actual peptide content:
- HPLC Purity: This refers to the proportion of the peptide material that consists of the target peptide sequence relative to other peptide-like impurities. If a sample has 98% HPLC purity, it means that of all the peptide molecules in the vial, 98% are the correct sequence, and 2% are truncated sequences, deletion fragments, or oxidized byproducts.
- Peptide Content: This is the actual weight percentage of the lyophilized powder that is made up of peptide molecules (both target and impure peptides). The remaining mass consists of counterions (such as trifluoroacetic acid [TFA] salts or acetate salts), residual moisture, and trace solvents.
During the final stages of solid-phase peptide synthesis, peptides are cleaved from the resin and purified using preparative HPLC. Because peptides contain basic groups (like arginine, lysine, or histidine), they require an acid to form stable, soluble salts. Typically, trifluoroacetic acid (TFA) is used in the mobile phase. Consequently, the resulting lyophilized powder is not a pure free-base peptide but rather a TFA salt.
This TFA salt, along with trapped water molecules (moisture), can easily make up 10% to 30% of the total lyophilized powder’s weight.
For example, if we have a vial labeled with 10 mg of a peptide that has a reported HPLC purity of 98% and a peptide content of 80%, the actual mass of the target peptide in that vial is calculated as:
$$\text{Actual Peptide Mass} = 10\text{ mg} \times 0.98 \times 0.80 = 7.84\text{ mg}$$
If we reconstitute the entire vial assuming there are 10 mg of active peptide inside, our final solution concentration will be more than 20% lower than intended. This discrepancy can lead to highly inaccurate experimental observations. Understanding this dynamic is crucial for precise reconstitution. To learn more about how these factors influence peptide behavior and performance in laboratory environments, read our comprehensive guide on Purity Is Only the Beginning: Why Bioavailability May Be the Real Standard in Peptide Quality.
For a deeper dive into decoding these numbers on paper, you can also consult the external resource How to Read a Peptide Certificate of Analysis (COA): Complete Guide .
The Analytical Chemistry of How to Test Peptide Purity
To understand how impurities end up in a finished peptide vial, we have to look briefly at how these molecules are built. Most research peptides are produced via Solid-Phase Peptide Synthesis (SPPS). This is a step-by-step assembly process where amino acids are added sequentially to a growing chain anchored to a solid resin support.
If a peptide is 30 amino acids long, the synthesis requires 30 individual coupling steps and 30 deprotection steps, followed by a final cleavage step. Even if every single coupling step is highly efficient—say, 99%—the cumulative yield of the correct full-length sequence before purification drops significantly over longer sequences.
The resulting crude mixture contains the target peptide alongside “deletion sequences” (chains missing one or more amino acids), truncated sequences (chains that stopped growing prematurely), and side-products created during the harsh cleavage process. To separate these closely related molecules, analytical chemists rely on two primary, complementary techniques: HPLC and Mass Spectrometry. For an in-depth look at the foundational science, check out The Complete Guide to Peptides in Scientific Research.
Utilizing HPLC: The Gold Standard of How to Test Peptide Purity
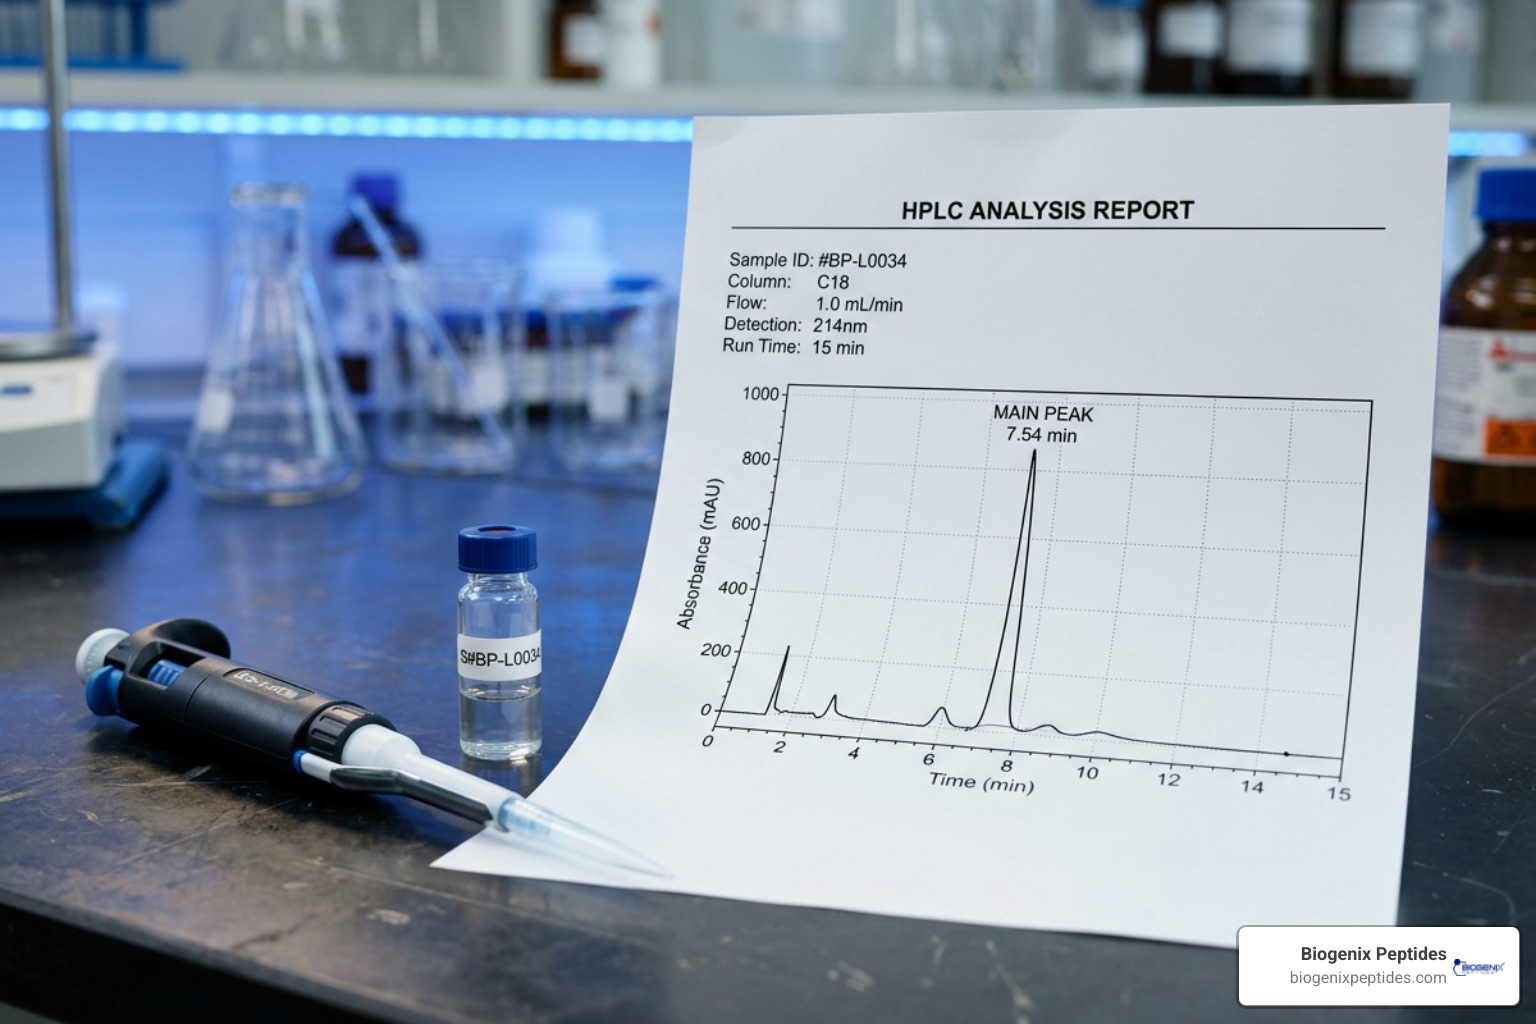
High-Performance Liquid Chromatography (HPLC) is the absolute gold standard for determining peptide purity. In reverse-phase HPLC (RP-HPLC), the peptide sample is dissolved and loaded into a column packed with a hydrophobic stationary phase (usually C18 silica beads). A mobile phase consisting of a gradient of water and an organic solvent (like acetonitrile) is pumped through the column.
Because different peptide fragments have slightly different hydrophobicities, they interact with the stationary phase with varying strengths. The target peptide and its impurities travel through the column at different speeds, separating from one another and exiting (eluting) at distinct times.
As these components elute, they pass through a UV detector. To interpret an HPLC chromatogram correctly, we must pay close attention to several key details:
- Wavelength Monitoring: The detector must be set to a wavelength that can capture all peptide-based impurities. The peptide bond absorbs strongly in the far-UV range, specifically between 214 nm and 220 nm. Monitoring at 254 nm or 280 nm is a major red flag; these wavelengths only detect aromatic amino acids (like tryptophan, tyrosine, and phenylalanine). If an impurity lacks aromatic residues, it will be completely invisible at 254 nm, artificially inflating the reported purity of the sample.
- The Main Peak: A high-purity sample will show a single, sharp, symmetrical peak standing out from a flat baseline.
- Co-eluting Impurities (Shoulders and Split Peaks): If an impurity has a chemical structure very similar to the target peptide, it may elute at almost the identical time. This appears on the chromatogram as a “shoulder” (a small bump on the side of the main peak) or a split peak. If the gradient method is not optimized, these peaks will merge, hiding the impurity entirely.
- Baseline Resolution: A reliable chromatogram should show the signal returning completely to the baseline before and after the main peak, indicating clear separation.
Developing these analytical methods requires precision. For those interested in the technical parameters of chromatography, read our guide on How to Develop Robust HPLC Methods for Peptides.
Mass Spectrometry: Confirming Identity and Spotting Mass Shifts
While HPLC tells us how many different compounds are in our vial, it cannot confirm that the main peak is actually our target peptide. A completely incorrect peptide sequence could theoretically elute at the exact same retention time as our target. That is why we must pair HPLC with Mass Spectrometry (MS).
Mass spectrometry measures the mass-to-charge ratio ($m/z$) of gas-phase ions. The two most common ionization techniques for peptides are Electrospray Ionization (ESI-MS) and Matrix-Assisted Laser Desorption/Ionization (MALDI-TOF).
When analyzing a mass spectrum, we compare the observed molecular weight to the theoretical molecular weight calculated from the peptide’s amino acid sequence.
- ESI-MS Multi-Charged Peaks: Peptides analyzed via ESI-MS typically acquire multiple protons (positive charges). For example, a peptide with a molecular weight of 1,500 Da might appear as a doubly charged ion $[M+2H]^{2+}$ at $m/z$ 751, or a triply charged ion $[M+3H]^{3+}$ at $m/z$ 501. The software deconvolutes these peaks to calculate the neutral mass.
- Acceptable Variance: The expected and observed molecular weight should agree within $\pm$1 Da for high-resolution ESI-MS, or $\pm$2 Da for MALDI-TOF.
- Common Mass Shifts and Adducts: Sometimes, the mass spectrum will show peaks that are heavier or lighter than expected. Understanding these shifts helps identify synthesis or purification issues:
- +22 Da or +39 Da: These represent sodium $[M+Na]^+$ and potassium $[M+K]^+$ adducts, which are common in mass spectrometry and generally do not indicate a degraded sample.
- -18 Da: This often indicates the loss of water, which can occur during ionization or point to the cyclization of N-terminal glutamine to pyroglutamate.
- -57 Da, -71 Da, etc.: These represent deletion sequences where a single amino acid was missed during synthesis (e.g., missing glycine is -57 Da; missing alanine is -71 Da).
For a comprehensive explanation of how to interpret these complex molecular spectra, consult our detailed resource on HPLC and Mass Spectrometry in Peptide Analysis
Evaluating Purity Thresholds and Contaminants
Not all research requires the same level of peptide purity. The acceptable threshold depends entirely on the nature of the experimental model. Using an excessively pure peptide for simple in vitro assays is unnecessarily costly, while using a low-purity peptide in sensitive biological models can introduce confounding variables that ruin months of work.
Below is a comparison of typical specifications for research-grade versus GMP-grade peptides:
| Specification Parameter | Research-Grade Peptides | GMP-Grade Peptides |
|---|---|---|
| Minimum HPLC Purity | $\ge$95% to $\ge$98% | $\ge$98% to $\ge$99% |
| Peptide Content | Typically not specified (often 70-85%) | Strictly quantified and standardized |
| Endotoxin Levels | Rarely tested unless requested | Strictly limited (typically $<5$ EU/kg) |
| Sterility (USP <71>) | No | Yes (mandatory sterile filtration & validation) |
| TFA Content | Present as default salt | Often exchanged for acetate or hydrochloride |
| Documentation | Basic COA (HPLC + MS) | Full batch records, validation, and traceability |
For basic screening assays or antibody production, a purity of 85% to 90% may be acceptable. However, for sensitive receptor-binding studies, cellular assays, or animal-model research, a minimum purity of $\ge$98% is highly recommended to prevent off-target effects caused by peptide impurities. To learn more about how synthesis methods impact these final purity grades, read our article on Peptide Synthesis Explained: Solid Phase vs Solution Phase.
Beyond the peptide sequence itself, we must also consider biological contaminants:
- Endotoxins: Endotoxins are lipopolysaccharides (LPS) found in the outer membrane of Gram-negative bacteria. They are highly pyrogenic, meaning they trigger severe inflammatory responses in biological systems. The standard assay for detecting these contaminants is the Limulus Amebocyte Lysate (LAL) test, which utilizes proteins extracted from the blood of horseshoe crabs. For sensitive in vivo research, endotoxin levels should ideally be below 0.1 EU/mg.
- Sterility Testing (USP <71>): This protocol involves incubating the peptide sample in specific media over 14 days to confirm the absolute absence of viable micro-organisms (fungi, aerobic, and anaerobic bacteria).
How to Verify a Certificate of Analysis (COA) and Spot Red Flags
A Certificate of Analysis is only as trustworthy as the laboratory that generated it. Unfortunately, the rise of unverified online peptide suppliers has led to an increase in fabricated, recycled, or altered COAs.
To protect the integrity of your research, we recommend using this 5-step verification workflow when evaluating a COA:
- Check for a Unique Batch/Lot Number: A legitimate COA must have a specific batch or lot number that matches the label on the physical vial. A generic COA without a batch number is like a vehicle inspection report with no VIN—it is completely worthless.
- Verify the Molecular Weight: Use an online bioinformatics tool such as ExPASy ProtParam. Input your peptide’s amino acid sequence to calculate its theoretical molecular weight, then compare it to the “observed” molecular weight listed on the MS sheet. They must match within $\pm$1–2 Da.
- Inspect the Chromatogram Baseline and Integration Table: Look closely at the HPLC chromatogram. Is the baseline completely flat, or does it look artificially smoothed or cropped? Check the integration table below the chromatogram. The sum of all reported peak areas must equal 100%. If the table is missing, or if major peaks on the graph are not listed in the integration table, the purity value has been manipulated.
- Watch for “Perfect” Round Numbers: In analytical chemistry, real-world measurements are rarely perfectly round numbers. If a COA lists a purity of exactly “98.00%” or “99.00%,” be highly suspicious. Genuine analytical results almost always feature decimal variations (e.g., 98.42% or 99.17%).
- Cross-Reference the Analytical Dates: Check the date of the analysis. If you purchased a peptide in July 2026, but the COA is dated from 2022, you are receiving old stock that may have degraded significantly during storage.
For a comprehensive guide on how to read and analyze these complex documents step-by-step, see our article How to Read a Peptide COA: Understanding HPLC & Mass Spectrometry (MS).
Implementing a Quality Control Protocol for Peptide Sourcing
If you are managing a research facility or sourcing peptides regularly, relying solely on manufacturer-provided documentation is a major risk. Establishing a systematic, in-house quality control protocol is the only way to guarantee absolute batch-to-batch consistency.
We advise implementing the following practices:
- Establish a Quality File: For every peptide batch received, archive the manufacturer’s COA, your independent test results, the purchase date, and the batch number.
- Determine Testing Frequency: You do not necessarily need to test every single vial if you have an established relationship with a highly reliable manufacturer. However, you should independently test the first batch from any new supplier. For ongoing suppliers, perform random spot-testing on every 5th or 10th batch to ensure they are maintaining their standards.
- Store Retention Samples: Always set aside a small, unopened vial from each batch as a “retention sample.” If an experiment yields anomalous or unexpected results six months down the road, you can pull this retention sample from the freezer and analyze it to rule out peptide degradation or contamination.
Partnering with a manufacturer that prioritizes these standards from the beginning makes a profound difference. Learn more about what goes on behind the scenes by reading The Secret Sauce of a Top-Tier Peptide Synthesis Company.
Why Third-Party Verification is Essential for How to Test Peptide Purity
Independent, third-party testing is the ultimate shield against substandard materials. Sending your samples to an accredited, independent analytical laboratory in the U.S. ensures that the testing is performed without bias.
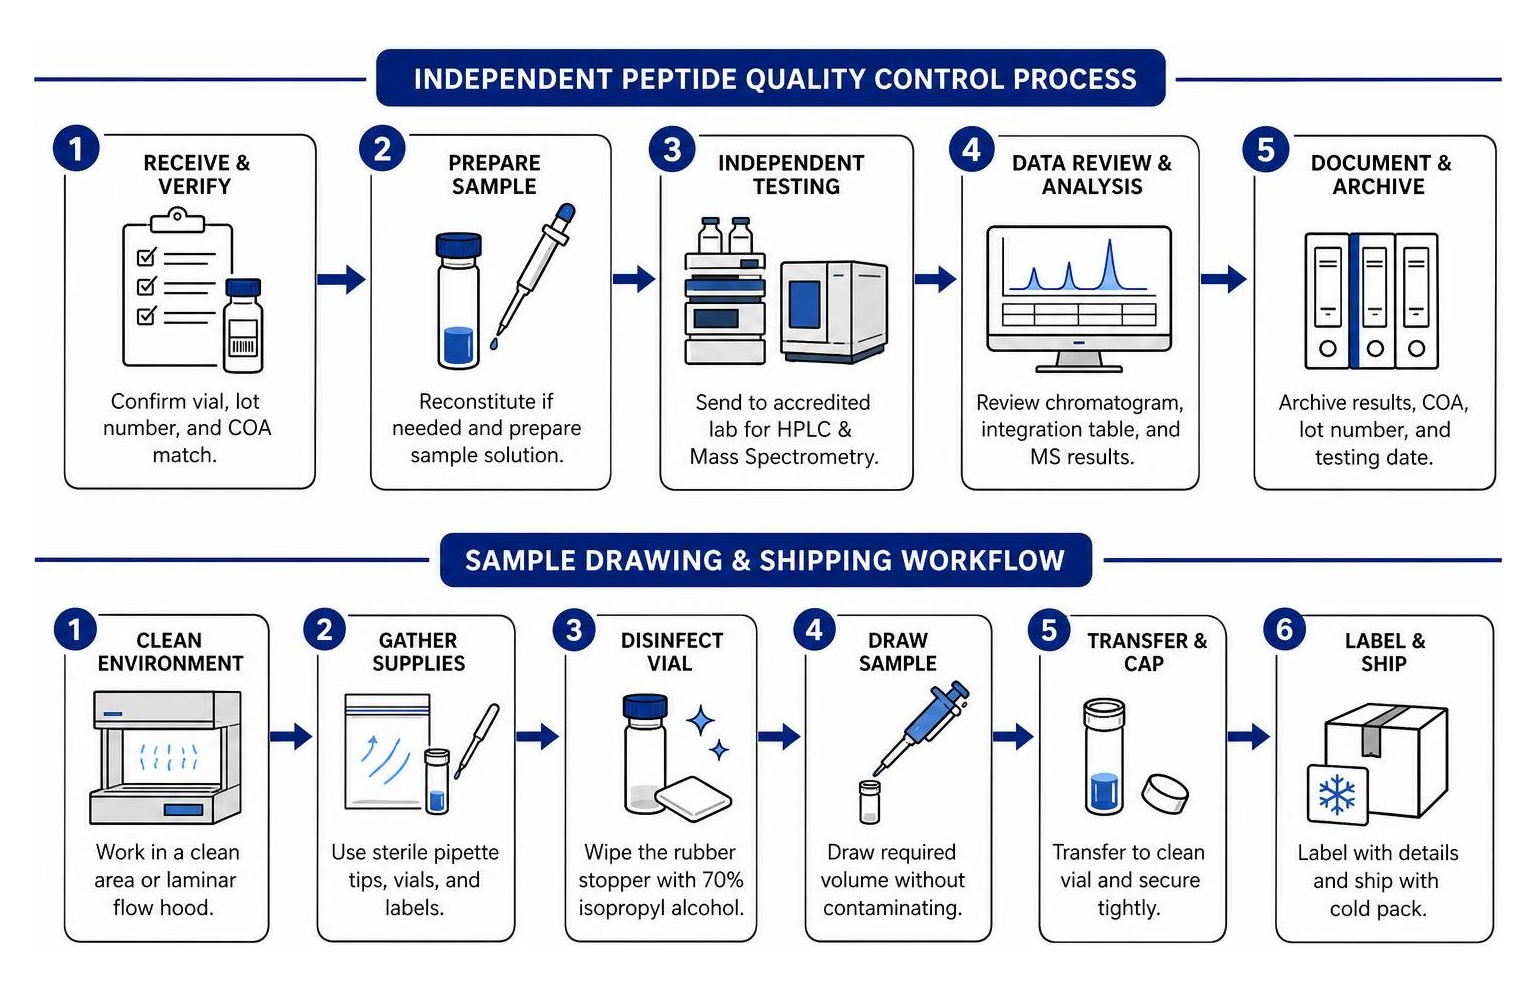
When preparing a sample to send out for independent testing, preventing contamination during the drawing process is absolutely critical. Even a tiny speck of dust, skin cells, or ambient moisture can introduce proteins and bacteria that skew your results.
Follow these steps to draw and ship a sample cleanly:
- Work in a Clean Environment: Ideally, draw your sample inside a laminar flow hood or a clean bench. If one is not available, work in a quiet room with closed windows and no active drafts.
- Wear Proper PPE: Always wear fresh gloves, a clean lab coat, and a face mask to prevent salivary or skin-cell contamination.
- Use Sterile Tools: Use sterile, single-use spatulas or pipettes to handle the powder. Never insert a used tool back into the primary sample vial.
- Minimize Air Exposure: Lyophilized peptides are highly hygroscopic—they pull moisture out of the air rapidly. Keep the vials open for the shortest time possible, and seal them immediately after drawing the aliquot.
- Ship on Dry Ice if Reconstituted: If you are sending a liquid sample, ship it on dry ice to prevent degradation during transit. Lyophilized samples can typically be shipped at ambient temperature, provided they are sealed in airtight, moisture-barrier packaging.
Investing in third-party testing may seem like an added expense, but it is a fraction of the cost of a ruined research project. To understand why identical-looking peptides can perform so differently in the lab, see our analysis on What Makes One Peptide 10x More Effective Than Another Even With the Same Name.
Shelf Life and Storage: Maintaining Purity Over Time
Once you have verified that your peptide is highly pure, the responsibility shifts to maintaining that purity. Peptides are delicate molecules held together by amide bonds, which can be broken down by heat, light, moisture, and enzymes.
The shelf life of a peptide depends heavily on its physical state and storage conditions:
- Lyophilized (Freeze-Dried) Peptides: In dry powder form, peptides are highly stable. When stored in an airtight container at -20°C (or ideally -80°C for long-term storage), most lyophilized peptides will maintain their purity and potency for 2 to 3 years.
- Reconstituted Peptides: Once a peptide is dissolved in a solvent (such as sterile bacteriostatic water or PBS), its shelf life drops dramatically. In solution, the peptide is highly susceptible to hydrolysis (cleavage by water molecules) and oxidation. Reconstituted peptides should always be stored at 2°C to 8°C and are generally stable for only days to a few weeks, depending on the specific sequence.
To prevent moisture condensation—which accelerates degradation—always allow a frozen vial of lyophilized peptide to warm up to room temperature on your lab bench before opening the cap.
Frequently Asked Questions about Peptide Purity
What is the difference between peptide purity and peptide content?
Peptide purity (typically measured by HPLC) indicates the percentage of the peptide material that consists of the correct amino acid sequence. Peptide content is the actual weight percentage of the powder that is peptide, with the remaining weight consisting of counterions (like TFA salts), moisture, and trace solvents.
Can I trust a manufacturer-provided COA?
While reputable U.S. and major international manufacturers operating under strict GMP standards provide highly reliable COAs, smaller trading companies or unverified online suppliers frequently fabricate or recycle documents. Independent, third-party testing is highly recommended to verify any manufacturer’s claims.
How should lyophilized peptides be stored to prevent degradation?
Lyophilized peptides should be stored in an airtight, moisture-sealed container at -20°C or lower. Avoid repeated freeze-thaw cycles, and always allow vials to reach room temperature before opening to prevent ambient moisture from condensing onto the cold powder.
Conclusion
Determining how to test peptide purity is not just about reading a single percentage on a sheet of paper. It requires a comprehensive understanding of analytical chemistry—combining HPLC to assess purity, Mass Spectrometry to confirm identity, and peptide content analysis to determine actual mass.
At BioGenix Peptides, we believe that rigorous scientific research demands absolute transparency. By understanding how to read chromatograms, spot COA red flags, and implement third-party testing protocols, you protect your research from the confounding variables of substandard materials. Purity on paper is only the first step. To explore how quality, structure, and formulation come together to dictate real-world performance, read our complete guide on Purity Is Only the Beginning: Why Bioavailability May Be the Real Standard in Peptide Quality.