Mastering the Peptide Dosage Guide for Research Success
Disclaimer: The information provided in this article is for educational and informational purposes only. It is not intended as medical advice, diagnosis, or treatment. Products and compounds referenced are for research use only and are not approved for human or veterinary consumption. Always consult a qualified professional regarding health or medical decisions.
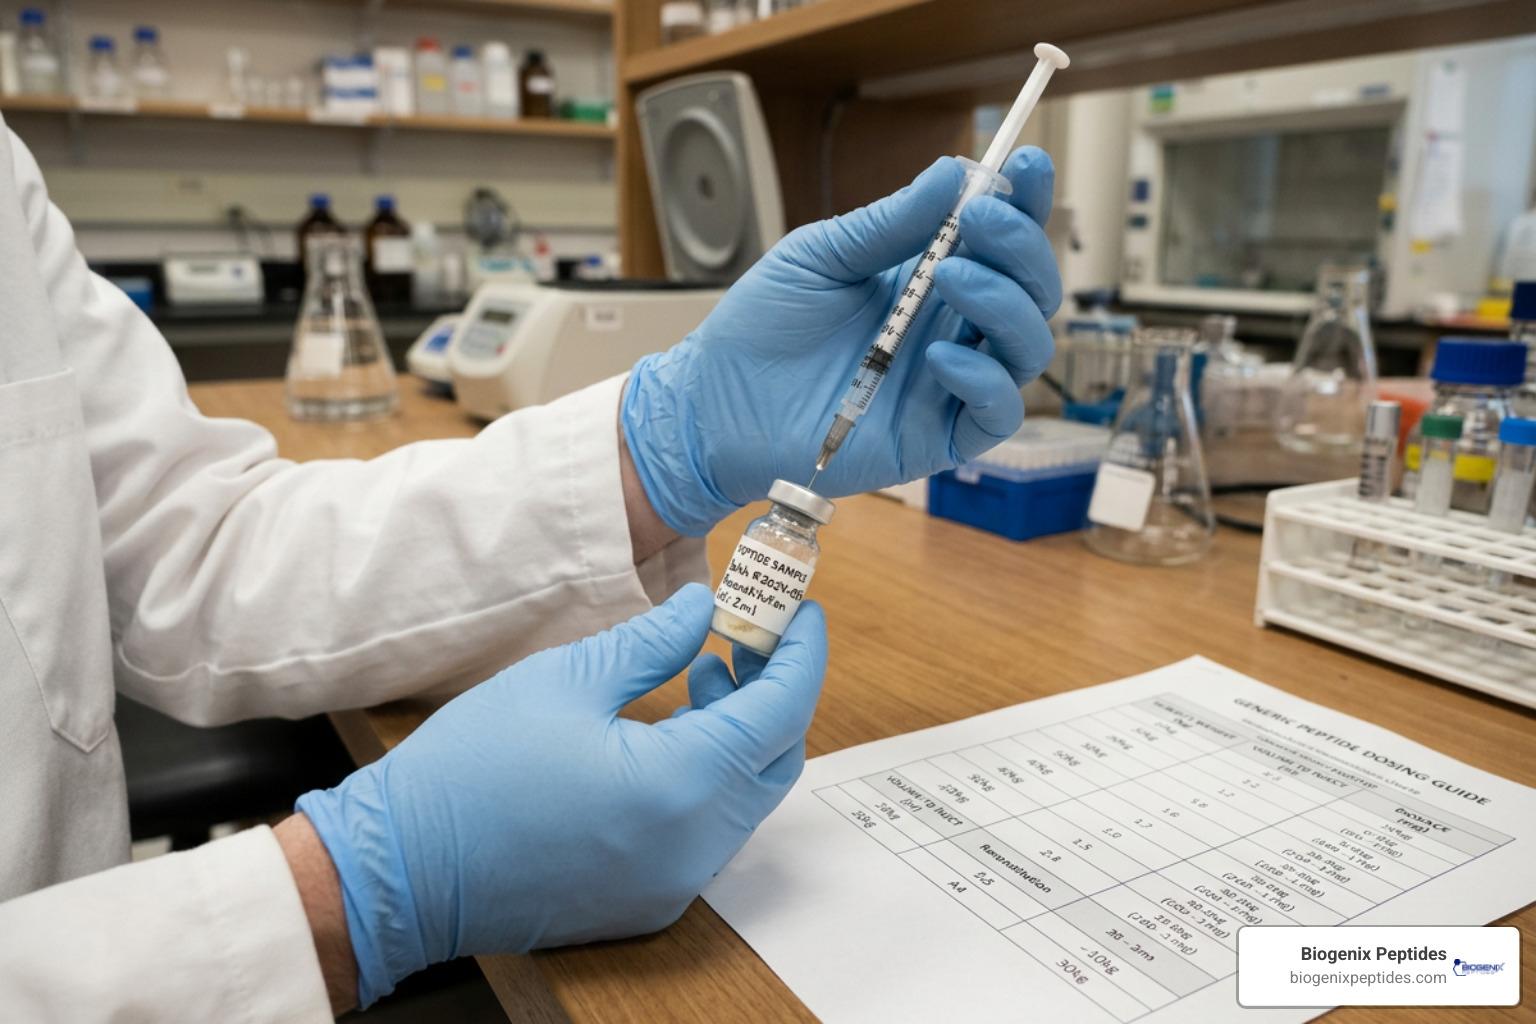
For laboratories working with research peptides, accuracy begins long before any material is introduced into an experimental model. It starts with clear recordkeeping, verified analytical data, correct solvent selection, and a repeatable calculation process that every member of the research team can follow. This article is presented as an educational, opinion-based overview for non-human research contexts only. It explains how a peptide dosing chart can support protocol planning, concentration review, and measurement consistency while helping researchers avoid preventable arithmetic or documentation errors. A well-built chart does not replace institutional procedures, supplier documentation, or qualified oversight, but it can serve as a practical checkpoint when designing controlled laboratory studies.
Understanding the Basics of a Peptide Dosing Chart
A peptide dosing chart serves as an indispensable reference tool in laboratory settings, translating theoretical protocol amounts into precise liquid measurements. In experimental science, maintaining absolute protocol standardization across subjects is essential for reliable data collection and scientific reproducibility. Without structured calculation tools, research settings face elevated risks of procedural errors, mathematical missteps, and inconsistent concentration preparation. In fact, research indicates that measurement mistakes occur in up to 15% of self-administered or non-standardized lab applications, primarily stemming from incorrect reconstitution ratios, confusing volumetric metrics, or inaccurate syringe readings.
Implementing a clear reference framework dramatically improves accuracy across all stages of experimental trial design. Over 70% of researchers report that utilizing a standardized peptide dosing chart reduces measurement error risks by at least 50%. By standardizing concentration references, investigators protect subject safety, maintain strict experimental controls, and preserve experimental integrity throughout multi-week observational studies. For researchers seeking to clarify fundamental laboratory terminology like lyophilization, molecular weight, solvent mass, or biological activity metrics, exploring Research Peptides Terms Demystified offers a strong foundational framework for protocol optimization and error prevention.
Reconstitution and Dosing Parameters for Research
Determining precise experimental parameters requires evaluating several interrelated variables prior to liquid reagent preparation:
- Subject Mass and Surface Area: In animal models, research amounts are typically calculated per kilogram of body weight or adjusted for body surface area to achieve predictable systemic exposure and metabolic clearance rates.
- Peptide Molecular Structure and Potency: Highly potent synthetic analogs demand significantly smaller absolute masses than natural amino acid sequences to achieve cellular responses and binding site saturation.
- Route Selection: Bioavailability varies based on whether a compound is introduced via subcutaneous tissue, intramuscular paths, or oral solutions, directly modifying the required liquid concentration and administration volume.
Reading Units on a Peptide Dosing Chart
Navigating a peptide dosing chart requires a sharp understanding of standard laboratory metrics and volumetric units:
- Milligrams (mg) vs. Micrograms (mcg): Mass is provided in milligrams or micrograms. Always remember that 1 mg equals 1,000 mcg. Misinterpreting this standard metric shift can alter liquid concentration by a factor of 1,000, severely compromising experimental validity.
- International Units (IU): Some peptide compounds use International Units based on biological activity rather than physical mass. IU scales are unique to specific compounds and cannot be converted to mass without standardized reference scales provided by analytical suppliers.
- Syringe Tick Marks: Graduated markings on standard insulin or tuberculin syringes measure volume in units or fractions of a milliliter (mL). On a standard 100-unit 1 mL syringe, each single unit mark represents exactly 0.01 mL.
Reconstitution Math and Dilution Steps
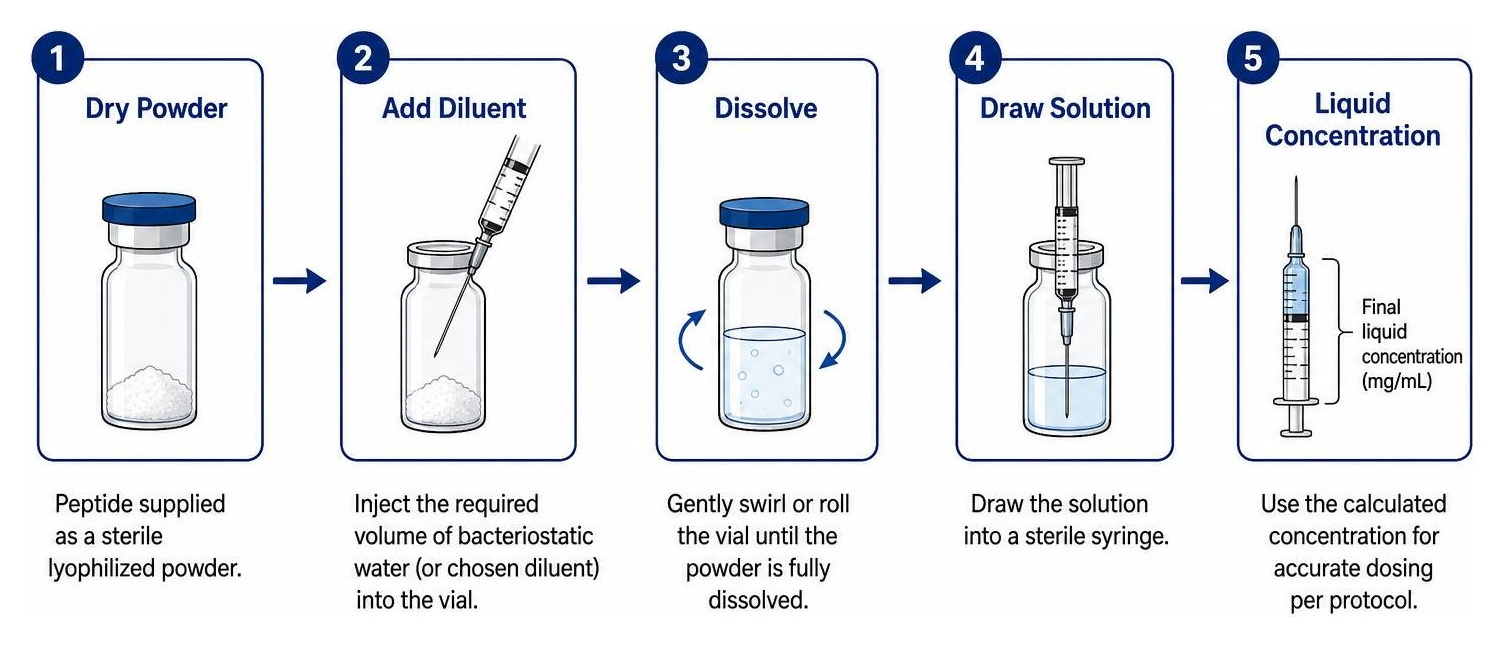
Reconstituting lyophilized powder into a stable liquid reagent requires methodical calculations. Adding a known volume of diluent—typically bacteriostatic water containing 0.9% benzyl alcohol—determines the final concentration per unit volume and preserves stability during refrigerated storage.
To calculate the target fluid concentration, apply this core equation:
$$\text{Final Concentration (mcg/unit)} = \frac{\text{Total Peptide Mass (mcg)}}{\text{Total Solvent Volume (units)}}$$
For example, mixing a 5 mg (5,000 mcg) vial of lyophilized powder with 2 mL (200 units) of bacteriostatic water yields a concentration of 25 mcg per single syringe unit mark (5,000 mcg ÷ 200 units = 25 mcg/unit).
To learn more about specific mixing techniques and concentration ratios, read BPC-157 Reconstitution Ratios Made Easy for Research or review How to Reconstitute Peptides in 5 Easy Steps.
| Vial Mass (Peptide) | Added Solvent Volume | Final Concentration (per 0.01 mL / 1 Unit) | Standard Reference Target Mass | Required Fluid Volume |
|---|---|---|---|---|
| 2 mg (2,000 mcg) | 1.0 mL (100 units) | 20 mcg / unit | 200 mcg | 10 units (0.10 mL) |
| 5 mg (5,000 mcg) | 2.0 mL (200 units) | 25 mcg / unit | 250 mcg | 10 units (0.10 mL) |
| 5 mg (5,000 mcg) | 2.5 mL (250 units) | 20 mcg / unit | 500 mcg | 25 units (0.25 mL) |
| 10 mg (10,000 mcg) | 2.0 mL (200 units) | 50 mcg / unit | 1,000 mcg (1 mg) | 20 units (0.20 mL) |
Standard Dosing Protocols for Key Peptides
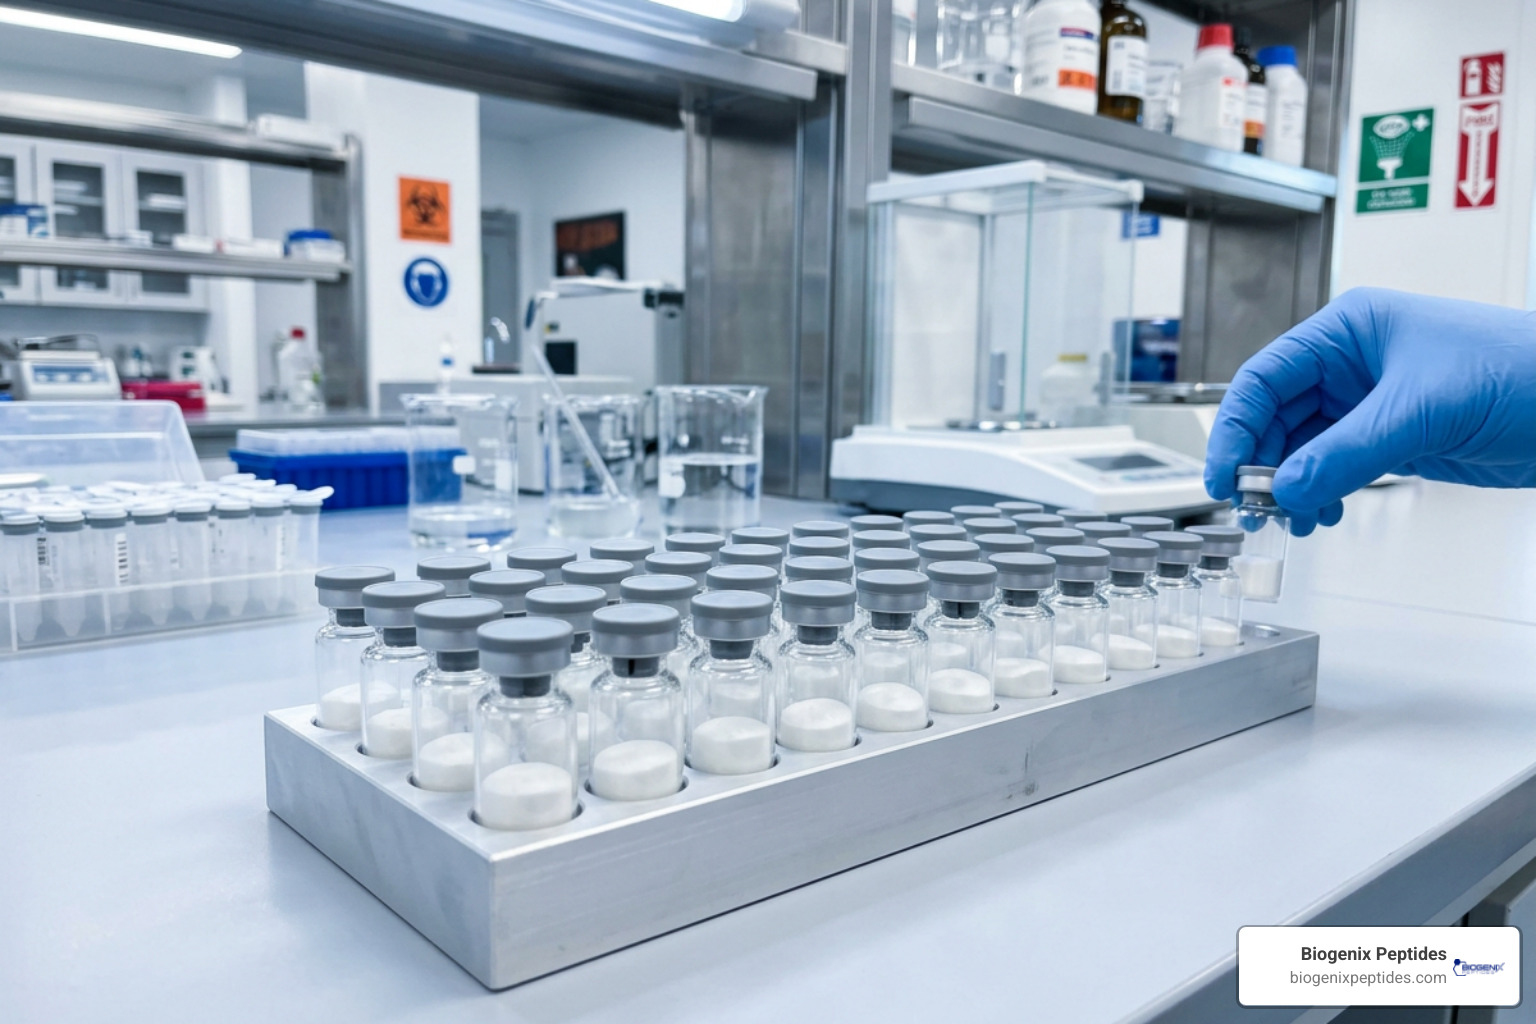
A comprehensive peptide dosing chart outlines structural metrics across distinct compound classes. Research benchmarks reflect parameters frequently observed in published literature across common experimental subjects, establishing standardized administration ranges for consistent trial evaluation.
Interpreting Protocols on a Peptide Dosing Chart
Published laboratory studies highlight widely monitored ranges across primary peptide groups:
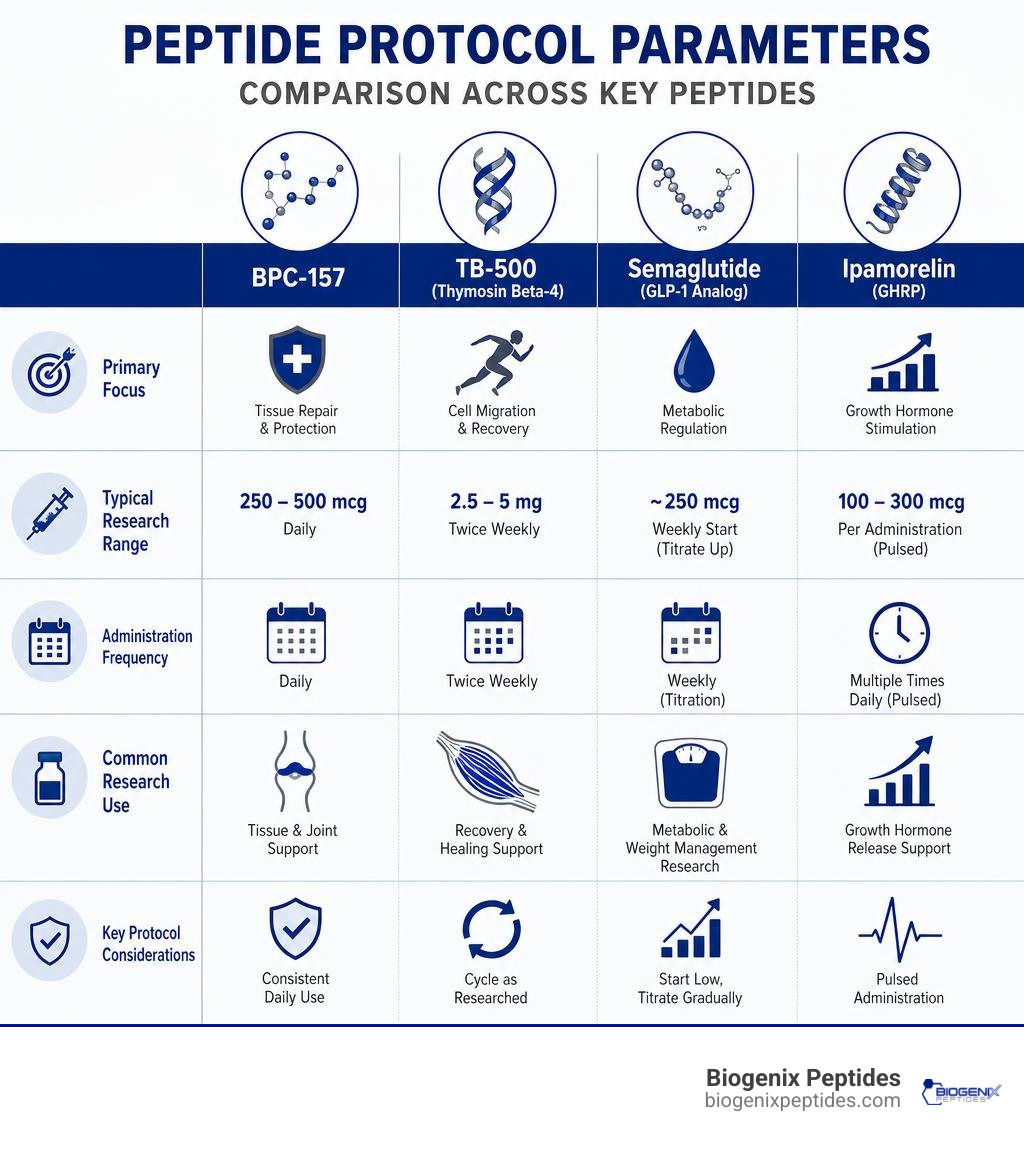
- BPC-157: The most frequently searched target range for this tissue-repair peptide spans 250 mcg to 500 mcg daily in animal research models, evaluated primarily for cellular regeneration pathways and localized tissue integrity.
- TB-500 (Thymosin Beta-4): Common protocols cite 2.5 mg to 5 mg evaluated twice weekly during initial investigative phases to assess actin-sequestering mechanisms and cell migration velocity.
- GLP-1 Analogs (e.g., Semaglutide): Protocols mandate gradual titration schedules, beginning around 250 mcg weekly and scaling incrementally to manage metabolic signaling sensitivity and gastrointestinal adaptation in test models.
- GHRPs (e.g., Ipamorelin): Growth hormone secretagogues are generally evaluated at 100 mcg to 300 mcg per single administration event, often structured as pulsed applications throughout the day to mirror natural growth hormone release cycles.
Protocol Adjustments: Titration, Cycling, and Administration Routes
Experimental designs frequently incorporate protocol adjustments to maintain subject responsiveness, prevent receptor fatigue, and minimize adverse events:
- Titration: Involves starting research at minimal target levels and gradually increasing amounts over multi-week schedules. This method is critical for metabolic regulators like GLP-1 and GIP receptor agonists to manage receptor kinetics without acute signaling saturation.
- Cycling Protocols: Continuous receptor activation can lead to receptor desensitization or downregulation over extended periods. Implementing scheduled rest periods (e.g., 8 weeks of active research followed by a 4-week wash-out break) restores baseline receptor affinity and protects data integrity.
- Administration Route Considerations: Subcutaneous routes provide slow, steady systemic absorption into peripheral capillaries. Intramuscular administration accelerates systemic exposure, whereas oral delivery requires specialized molecular protective carriers due to aggressive enzymatic degradation in the digestive tract.
Frequently Asked Questions About Research Protocols
How do research dosing protocols differ from human clinical administration guidelines?
Research protocols are tailored specifically for investigational animal models, in vitro cell cultures, or isolated biological systems. They focus on establishing safety parameters, pharmacokinetic profiles, binding affinity, and biochemical pathways rather than delivering therapeutic outcomes. Consequently, values appearing on laboratory charts should never be directly applied to human clinical settings or non-research applications.
What are the most common calculation mistakes made during peptide research?
The primary errors in peptide research involve confusing milligrams (mg) with micrograms (mcg), using incorrect solvent volumes during reconstitution, and misinterpreting syringe unit markings on graduated volumetric instruments. Miscalculating these basic variables can skew target concentration levels significantly. For an in-depth review of common laboratory pitfalls and prevention strategies, read The 10 Most Common Mistakes People Make When They’re New to Peptide Research.
Where can researchers find verified dosing charts and analytical documentation?
Researchers should source reference documentation directly from published scientific literature, official laboratory standard operating procedures (SOPs), and reputable research suppliers. Verified analytical standards are typically accompanied by a Certificate of Analysis (COA) detailing purity verified via High-Performance Liquid Chromatography (HPLC) and Mass Spectrometry (MS) testing.
Conclusion
Accurate metric verification, careful reconstitution math, and strict adherence to experimental protocols form the essential foundation of reliable scientific inquiry. Utilizing a structured peptide dosing chart guarantees reproducible research results, safeguards subject integrity, minimizes calculation errors, and maintains consistent analytical standards throughout experimental trials.
At BioGenix Peptides, we are committed to advancing scientific research by delivering high-purity, laboratory-tested compounds backed by comprehensive analytical documentation and detailed reference materials. To learn more about trusted industry sources for reference guides, review our breakdown of 5 Research Chemical Suppliers with Peptide Dosing Charts. Ready to equip your laboratory with top-tier research material for your next investigative study? Explore Research Peptides Catalog today.